
What we log now that we didn't log in the first deployment
Ujjaval Rana
Author
Our first agent had traces. They looked complete. Then a real incident happened and the traces couldn't answer one simple question: why. Here are the four things we log now, and the bug that made each one non-negotiable.
The Short Version
- A normal trace tells you what happened. An agent trace also has to tell you what the model saw and why it chose that.
- We now log four extra things: every input the model saw, tool calls in full, the options the agent rejected, and human overrides with a reason.
- Plus: cost on every step, redaction before export, and retention set per step, not per run.
- None of it is hard. The hard part was admitting the first version couldn't answer real questions.
The ticket that started it
Picture this. You're on call. A support lead pings you: "The agent told a customer their refund was approved. It wasn't. Can you find out why?"
You open the trace. Here is what you see: request came in, four model calls, six tool calls, one answer, status: completed, 38 seconds. Each tool call is one line: a name and a duration. lookup_order 210ms. check_refund_policy 180ms.
And that's it. You can't see what the agent asked those tools. You can't see what came back. You can't see why it went from "here's the order" to "yes, refund approved". You spend most of a day pulling request logs from the model provider and reading the policy doc by hand.
The answer, when we found it, was almost boring: lookup_order returned a cached record that was 41 minutes old. The refund had already been reversed. The model reasoned perfectly on stale data. But we had no way to see that, because the trace only recorded that the tool ran, not what it returned or how old that data was.
The developer's frustration, in one line
Our trace could answer "did it finish?" and "how long did it take?" It could not answer "what did it see?" or "why did it do that?" For an agent, those are the only two questions anyone actually asks.
Why a normal trace isn't enough for an agent
Think about tracing a regular microservice. The code is fixed. If you know the input and the version, you know what it will do. So the trace only needs to record what varies: timings, IDs, status codes. You don't log the code, because you can read it in the repo.
An agent flips this. The code is small and stable. The behaviour is decided at runtime by a model reading its context: the system prompt, the retrieved documents, the tool results, the previous turns. That context is effectively the program. If the trace doesn't capture it, you have a trace of a program you can't read.
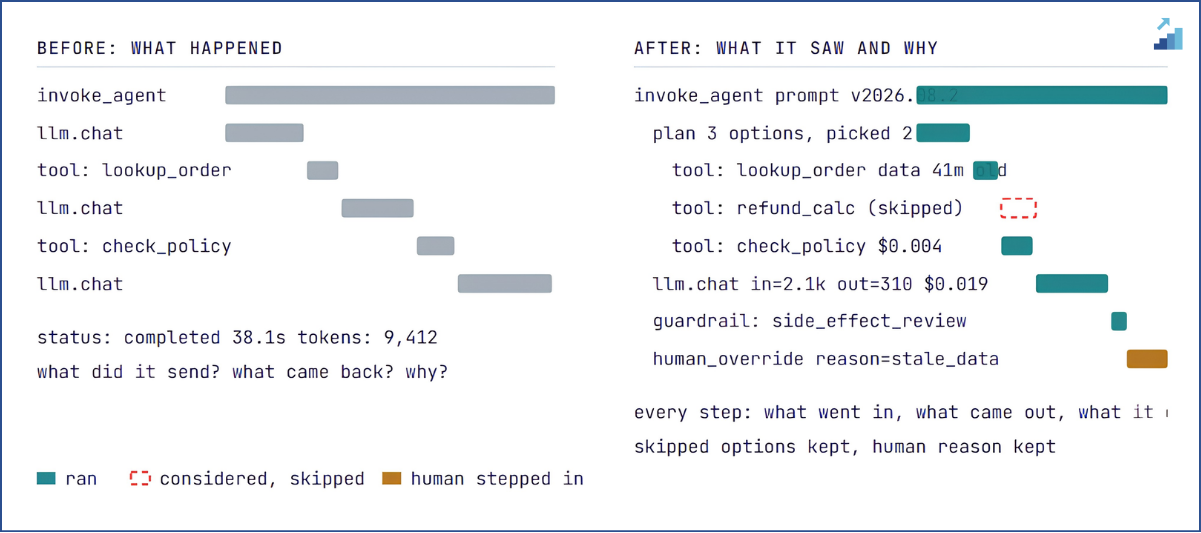
Fig 1. Same request, two generations of tracing. Left answers "did it finish". Right answers "what did it see, what did it skip, what did each step cost, and where did a person step in and why".
The four things we log now
1. Every input the model saw, with a version
What we used to log: the user's message.
What we log now: the user's message, plus a hash and version label of the system prompt, the retrieved documents (with their IDs and how old they are), the tool definitions the model was shown, the model name and sampling settings.
Why: the user message is maybe 5% of what the model actually reads. In our refund incident, the thing that mattered was a cached order record passed in as context. It was never logged because it was "internal". Now it's on the span, along with its age.
From a developer's seat
Someone edits the system prompt on Tuesday. On Thursday the agent starts behaving differently. Without a prompt hash on every trace, you're diffing git history against a timestamp and guessing. With it, you filter traces by prompt.hash and the change point is obvious in thirty seconds.
2. Tool calls in full, including whether they touch the real world
What we used to log: tool name and duration.
What we log now: the arguments the model produced, the result (or a redacted summary and its size), errors, how many tokens the result added to the next model call, and a side_effect flag: does this tool change something outside the agent (send an email, write a record, charge a card)? If yes, it also carries an idempotency key.
Why: two reasons. First, "what did the tool return" is the answer to most incidents. Second, the side-effect flag settles arguments like the one we had in week two: the reasoning trace said decided to notify customer, the mail provider showed two emails, and nobody could say whether the model called the tool twice or the tool retried. Now the idempotency key tells us.
From a developer's seat
Your agent's cost jumped 3x overnight. Run-level totals show every run got more expensive. Useless. But tokens_added on each tool span shows one retrieval tool now returns 8,000 tokens instead of 800, and every later model call re-reads all of it. Someone changed top_k. Fixed in five minutes.
3. The options the agent considered and rejected
What we used to log: the tool the agent called.
What we log now: the tools it could have called at that decision point, which ones it picked, a one-line justification from the model, and for each option it skipped, a reason code: model preference, guardrail blocked it, budget ran out, timed out.
Why: the most common question in any review is "why didn't it do X?" In the first deployment the trace only showed the winner, so our answer was "the model chose not to." Nobody can act on that. Now the skipped option is a span in the trace with a reason attached.
From a developer's seat
Product asks: "Why didn't the agent check the refund calculator?" You open the trace. Under the plan span, refund_calc is right there, status not_executed, reason model_preference, and the plan's justification says "order status sufficient; calculator only if amount disputed". Now you have a real conversation: was that rule right? That's a prompt fix, not a mystery.
Bonus: every skipped option that a human later says should have run is a ready-made test case for your eval suite, with the full context already attached.
4. Human overrides, with a reason the person picks
What we used to log: "run ended with a human decision."
What we log now: who (a stable pseudonymous ID), what action (approve, edit, reject, escalate), what they replaced, how long they took, and a reason category from a short list. Free text is optional; the category is required.
Why: six weeks in, someone asked "how many overrides are because the agent was wrong, versus because our policy changed?" We couldn't answer. "Why" had never been a field. Now override rate by reason is the most-watched chart on the platform, because it's the only thing that tells you whether the agent is drifting or the world is.
From a developer's seat
Override rate climbs from 4% to 11% over two weeks. Panic? Not yet. You group by reason code. agent_wrong is flat. policy_changed tripled. Legal updated the refund policy and nobody updated the prompt. That's a one-line fix and a process gap, not a model problem. Without the reason code, you'd have spent a week retraining evals for nothing.
Three things that came along for the ride
Cost on every step. Token counts on each model call, priced against a versioned rate card, and rolled up through the tree. The trace answers "which step burned the money" instead of "this run cost $0.41".
Redaction before export, not in your app code. Prompts and tool results are exactly where personal data hides. We redact in a span processor before anything leaves the process, replace user IDs with keyed hashes so grouping still works, and never touch timings or sequence. The 2 a.m. debugger still sees the shape of the run.
Retention per step, not per run. Metadata and cost: a year. Content: 30 days. Anything with a human override or a side-effect tool: at least six months, which is also the floor the EU AI Act sets for high-risk systems. One rule for a whole trace was either too short for audit or too long for privacy.
What one span looks like now
// A plan span with its children, second deployment (trimmed)
{
  "span": "plan",
  "candidates": ["lookup_order", "refund_calc", "check_policy"],
  "chosen": ["lookup_order", "check_policy"],
  "justification": "order status sufficient; calculator only if amount disputed",
  "children": [
    { "span": "execute_tool", "tool": "lookup_order",
      "result_age_s": 2460, "tokens_added": 1210,
      "side_effect": false, "cost_usd": 0.0 },
    { "span": "execute_tool", "tool": "refund_calc",
      "status": "not_executed", "reason": "model_preference" },
    { "span": "execute_tool", "tool": "check_policy",
      "tokens_added": 640, "cost_usd": 0.004 }
  ]
}
{ "span": "human_override", "actor": "u:hm-2f81", "action": "reject",
  "reason_code": "stale_data",
  "reason_text": "order updated 40 min ago, refund already reversed" }
Read that and the incident explains itself. The tool returned old data (result_age_s: 2460). The model reasoned correctly on it. The reviewer said so in a code that points at the tool, not the model. The fix is a cache policy, and the eval suite gains a labelled case.
The same run, as it scrolls past in your logs
Spans are what the backend stores. Logs are what you actually watch. Here is the refund run twice, first as our old logs printed it, then as they print it now. Both are dummy samples; timestamps, IDs and values are made up, but the shape is exactly what you'd tail in a console.
First deployment. Every line true, none of them useful:
$ tail -f agent.log   # before
10:41:02.114 INFO  run=7f3a  request received
10:41:02.892 INFO  run=7f3a  llm call complete (1.2s)
10:41:03.104 INFO  run=7f3a  tool lookup_order ok (210ms)
10:41:04.310 INFO  run=7f3a  llm call complete (0.9s)
10:41:04.492 INFO  run=7f3a  tool check_policy ok (180ms)
10:41:08.201 INFO  run=7f3a  llm call complete (3.7s)
10:41:08.223 INFO  run=7f3a  response sent, status=completed, 38.1s total
Second deployment. Same run, same seven seconds of wall clock, but now the log tells the story on its own:
$ tail -f agent.log   # after
10:41:02.114 INFO  run=7f3a  invoke_agent refunds-assistant
                   prompt=2026.08.2 (a91f) tools_schema=6e0c mode=sanitized
10:41:02.890 INFO  run=7f3a  plan: candidates=[lookup_order, refund_calc,
                   check_policy, issue_refund] chosen=[lookup_order, check_policy]
                   why="order status sufficient; calculator only if disputed"
10:41:03.104 WARN  run=7f3a  tool lookup_order ok (210ms) result_age=41m
                   tokens_added=1210 side_effect=no  [stale: age > 15m threshold]
10:41:03.106 INFO  run=7f3a  tool refund_calc SKIPPED reason=model_preference
10:41:03.107 INFO  run=7f3a  tool issue_refund SKIPPED reason=guardrail_block
                   guardrail=side_effect_review verdict=block
10:41:03.290 INFO  run=7f3a  tool check_policy ok (180ms) tokens_added=640
                   cost=$0.004
10:41:08.201 INFO  run=7f3a  chat in=5.9k out=280 finish=stop cost=$0.031
                   ctx=[tool:call_01, retrieve:r_09, msg:u_1]
10:41:08.223 INFO  run=7f3a  draft ready, held for review (side-effect path)
10:41:49.410 WARN  run=7f3a  HUMAN OVERRIDE actor=u:hm-2f81 action=reject
                   target=chat:9c02 reason=stale_data review_took=41.2s
                   note="order updated 40 min ago, refund already reversed"
10:41:49.412 INFO  run=7f3a  outcome=overridden cost_total=$0.058
                   overrides=1 skipped=2 retention=decision
Notice what changed. The stale data announces itself at 10:41:03 with a WARN, five seconds before the model even drafts the wrong answer. The two skipped tools are right there in the stream with reasons. And the override line alone, actor, target, reason, note, is the entire incident report. In the first deployment, this same story took a day of cross-referencing to reconstruct. In the second, it's readable in a terminal before your coffee cools.
Before and after: the questions you can answer
- What did the model actually see on step 3?Before: no idea → After: hashes and refs on the span
- Why didn't it call tool X?Before: "it chose not to" → After: skipped span with reason code
- Did the email send once or twice?Before: check the mail provider → After: idempotency key on the span
- Which step made this run expensive?Before: total only → After: cost and tokens_added per span
- Is the agent drifting or did the world change?Before: can't tell → After: override rate by reason
- Can we prove what happened six months ago?Before: content aged out → After: decision spans kept 6+ months
Where this sits in your stack
Everything above is about what to record. Here is where it lives. The pieces are ordinary: your agent, OpenTelemetry instrumentation inside it, a span processor at the edge of the process, a collector, a backend, and the two consumers that make the data worth collecting: your evaluation suite and your audit exports. Nothing here requires a new vendor; it requires putting redaction and retention in the right place in an ordinary pipeline.
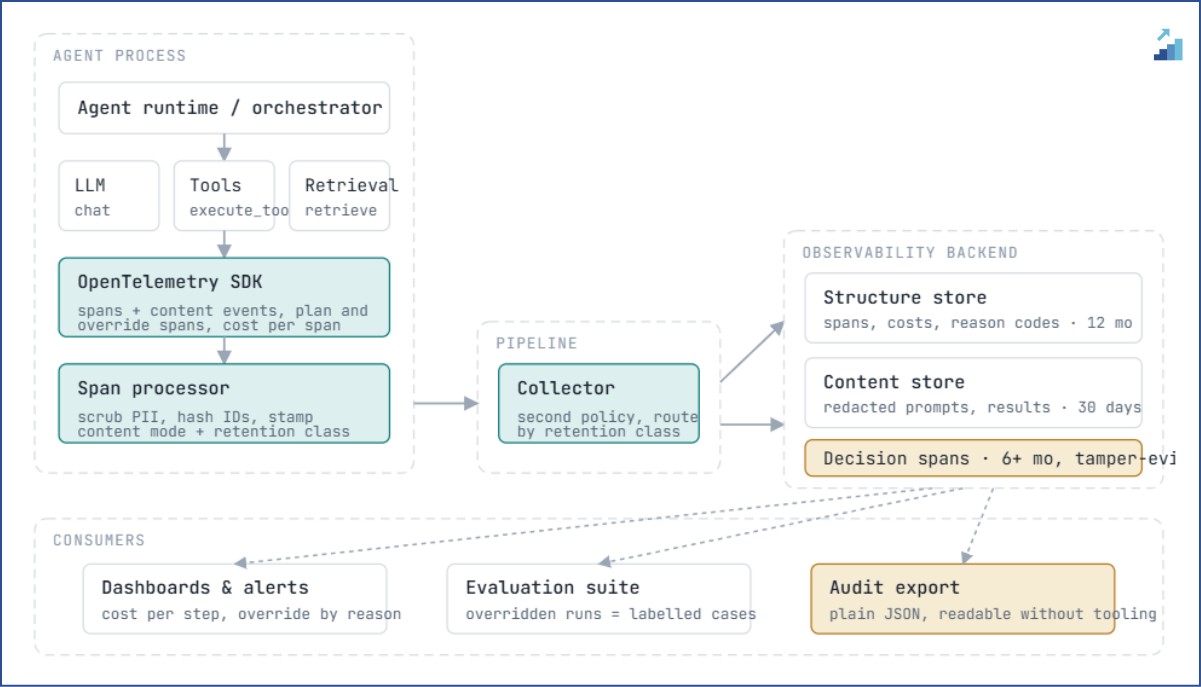
Fig 2. The reference architecture. Redaction sits in the span processor, inside the process boundary, so nothing unscrubbed ever leaves. The collector routes by retention class. Decision spans get their own long-lived, tamper-evident storage, and the eval suite and audit export are consumers of the trace, not separate systems.
Three placement decisions carry all the weight. The span processor sits inside the process, so content is scrubbed before it crosses any network. The collector routes by retention class, which is how one pipeline serves both a 30-day content store and a six-month audit store without duplicating anything. And the evaluation suite reads from the same backend as the dashboards, which is what turns every override and every wrongly skipped option into a test case with zero extra plumbing.
If you're instrumenting an agent for the first time
- Log the context, not just the request. Put a hash or reference for every input on the span that used it: prompt version, retrieved chunks, tool schemas.
- Make "skipped" a valid span status. If your trace can't show an option the agent considered and dropped, you'll never answer "why didn't it".
- Overrides are events with reasons, not buttons. Require a reason category. Store what was replaced.
- Put cost on the span. Run totals hide the one retrieval step doing all the damage.
- Redact before export, hash for grouping. Do it in the processor so a policy change doesn't need an app release.
- Set retention per span kind. Content short, metadata long, human decisions and side effects at least six months.
- Use the standard names where they exist. The OpenTelemetry GenAI conventions already define agent, chat and tool spans. Use them, and put your extras in your own namespace so a backend swap isn't a rewrite.
None of this is exotic. It's distributed tracing plus three things the agent world forces on you: skipped options, human decisions, and cost per step. The code took a sprint. The hard part was accepting that a trace which looked complete on a dashboard couldn't answer the first real question anyone asked of it.
Ujjaval Rana
Technology specialist and regular contributor at BlueData Consulting, sharing insights on machine learning, cloud architectures, and digital transformations.